
Our Story
April 22, 1970

The First Earth Day

HOWEVER
Environmental Gains Are Undermined By Population Growth.

The U.S. Cut Per Capita CO2 Emissions By 35%
But population growth overwhelmed per capita efficiency gains
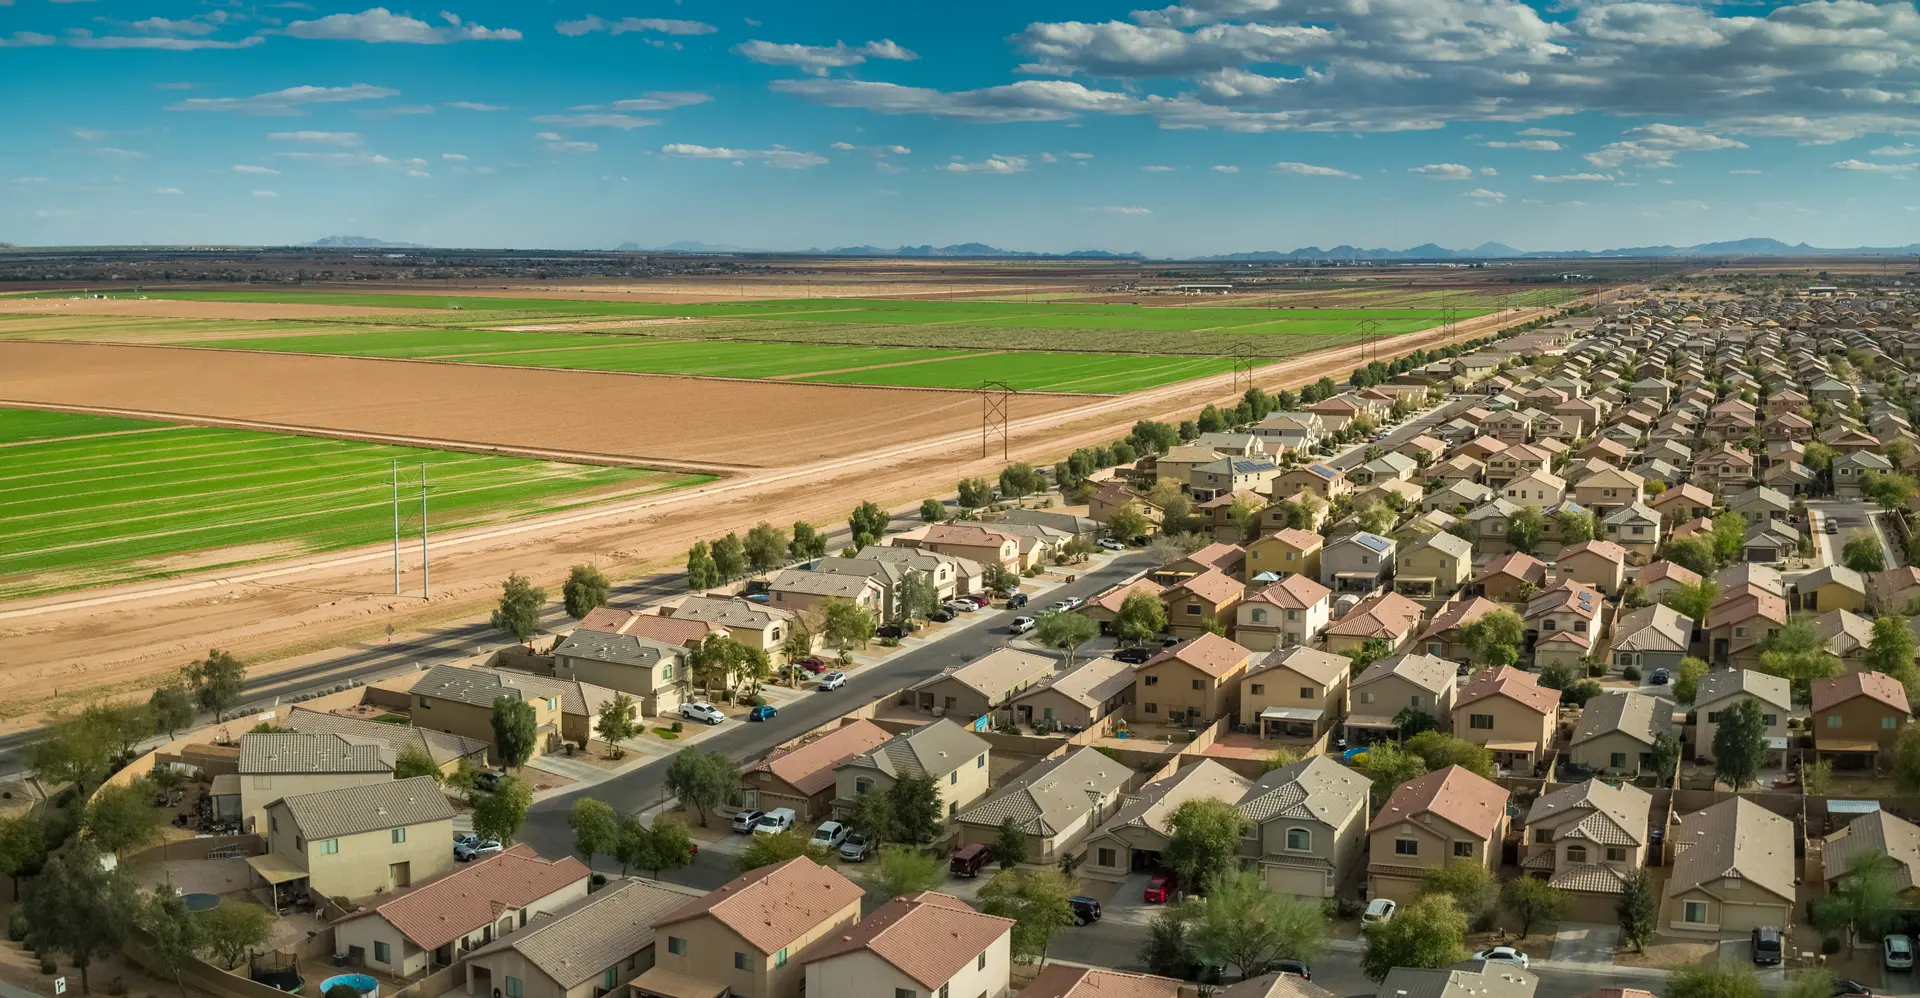
One Step Forward, Two Steps Back
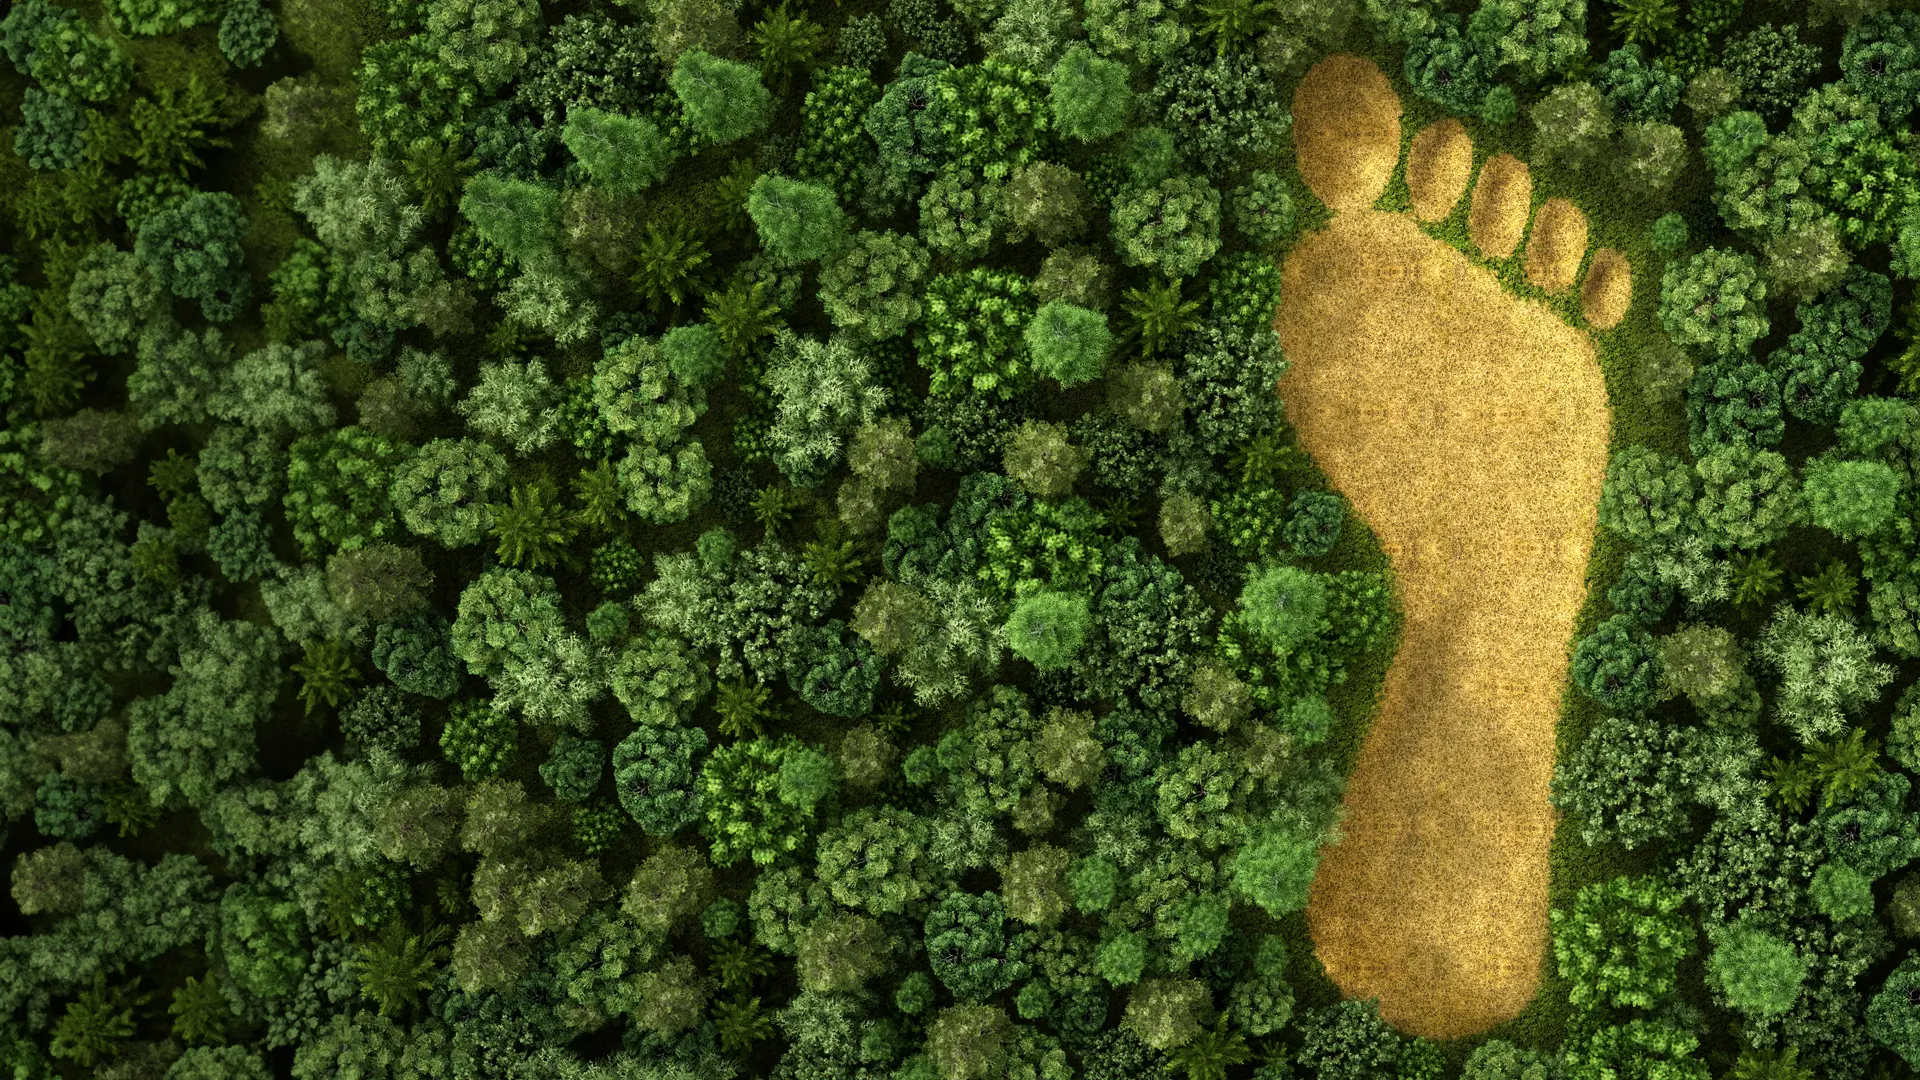
The U.S. Has Been in Severe Ecological Overshoot Since 1970
Ecological footprint
“A measure of how much area of biologically productive land and water an individual, population or activity requires to produce all the resources it consumes and to absorb the waste it generates, using prevailing technology and resource management practices.” See the Global Footprint Network’s Glossary for more definitions: Glossary - Global Footprint Network
Ecological Deficit
“An ecological deficit occurs when the Ecological Footprint of a population exceeds the biocapacity of the area available to that population. A national ecological deficit means that the nation is importing biocapacity through trade, liquidating national ecological assets or emitting carbon dioxide waste into the atmosphere. An ecological reserve exists when the biocapacity of a region exceeds its population's Ecological Footprint.” – Global Footprint Network
The U.S. was consuming 227% of its available biocapacity in 1970. By 2020, that number had increased to roughly 240% despite massive efforts and expenditures to reduce it. Between 1970 and 2020, per capita biocapacity use decreased more than 20%, meaning 100% of the overall increase in biocapacity use (all of which was additional overshoot) was the result of human population growth.
However, the overshoot calculations above assume humans have the right to appropriate all available biocapacity and leave nothing for other species. If we want to set aside 30% of the natural world for other species, as the 30x30 initiative targets, the U.S. was at roughly 341% biocapacity utilization in 2020. If we want to achieve the more ambitious goal of leaving half of nature for other species, the U.S. was at 478% biocapacity utilization in 2020.
How Much of the Natural World Should Humans Leave for Other Species?
The “30 x 30” initiative directs 30% of the United States be left for other species. “Half Earth” proposes half the Earth’s surface area be designated a natural reserve in order to save at least 80% of Earth’s species. But currently, here in the U.S. and around the world, the human population is consuming biocapacity at a pace that will leave virtually nothing for other species.

Humans consume 100% of nature

Humans consume 70% of nature

Humans consume 50% of nature
Total ecological footprint data provides the most comprehensive measure of sustainability but it can be difficult to visualize what these calculations mean for ecosystems in the real world.
Land use data indicates by 2020 the U.S. had paved or built over the equivalent of Montana, West Virginia, and South Carolina combined while 52% of the U.S. land base was consumed by agricultural uses and only 13% enjoyed any level of conservation protections.



Human population pressure and its associated effects have robbed wildlife of its natural habitat. The results are profound. The North American bird population has decreased from ten billion to seven billion in fifty years.
Wildlife populations in general have seen similar declines.

The rest of the content is best viewed on a desktop.
2.9 Billion Birds have been lost since 1970


Declining U.S. Wildlife Species
Percent of species that the IUCN lists as threatened or near threatened that have declining populations

Declining U.S. Wildlife Species
Percent of species that the IUCN lists as threatened or near threatened that have declining populations

Declining U.S. Wildlife Species
Percent of species that the IUCN lists as threatened or near threatened that have declining populations

Wild vertebrate animal populations have halved in the period the human population has doubled.
1970
2017
Source: WWF Living Planet 2016; United Nations Population Division
Weight of Vertebrate Land Animals
10,000 Years Ago
99% Wild Animals | 1% Humans
Calculations based on Smil (2011)
Weight of Vertebrate Land Animals
Today
1% Wild Animals | 32% Humans | 67% Livestock
Calculations based on Smil (2011)

How did we get here?
Where we started
· The first Earth Day celebration identified the need to curb environmental degradation resulting from both per capita consumption and human population growth.
· In 1970, total fertility rate (TFR) in the U.S. was 2.54, resulting in a 1.25% population growth rate.
· 1.25% may seem low, but at that growth rate it would have taken only 57 years for the U.S. population to double from 205 million to 410 million. In other words, in 1970 the U.S. was on track to have 410 million people by 2027.
Total fertility rate stabilizes
· The U.S. achieved the environmental milestone of a total fertility rate (TFR) below 2.1 (replacement level fertility) by empowering women to take control of their reproductive choices.
· A sustained TFR of 2.1 would have resulted in population stabilization over several decades.
· TFR has never gone above 2.1 in the U.S. since 1972.
U.S. population grows by 45 million
· The U.S. population increased by 45 million between 1970 and 1990.
· Immigration became the main driver of U.S. population growth around 1990.
· Roughly 133,000 square miles of land in the U.S. was consumed by human-made structures and surfaces by 1990.
· U.S. biocapacity consumption rose to 237%, up 10 percentage points from 1970.
U.S. population grows by 32 million
· The U.S. population increased by 32 million between 1990 and 2000.
· U.S. biocapacity consumption rose to 267%, up 30 percentage points from 1990.
· Roughly 156,000 square miles of U.S. land was consumed by human-made structures and surfaces by 2000, an increase of 23,000 square miles since 1990.
U.S. population grows by 48 million
· The U.S. population increased by 48 million between 2000 and 2020.
· 1965 - 2020 immigration scenarios between zero and actual levels would have resulted in a 2020 population between 255 million and 330 million.
· 1,300 species were listed as either endangered or threatened in the U.S. under the Endangered Species Act (ESA) by 2020.
· 23 species were proposed for delisting from ESA due to extinction in 2021.
· Over 187,000 square miles of U.S. land was consumed by human-made structures and surfaces by 2020, an increase of 31,000 square miles since 2000.
· North American wildlife populations declined 20% since 1970.
Immigration will determine the future of U.S. population growth.
· 82% of population growth from 2005 to 2050 will be a consequence of immigration alone.
· Immigration is projected to account for 103 million in U.S. population growth by 2065.
· The larger the US population, the less likely the U.S. will meet its Paris Climate goal; the more difficult it will be to conserve native species; the larger America’s total ecological footprint will become.
· U.S. citizens have the right and the responsibility to collectively act to limit our total ecological footprint. The future of biocapacity consumption, urban sprawl, bird population, air pollution, and overall number of threatened, endangered, and extinct species is up to us.
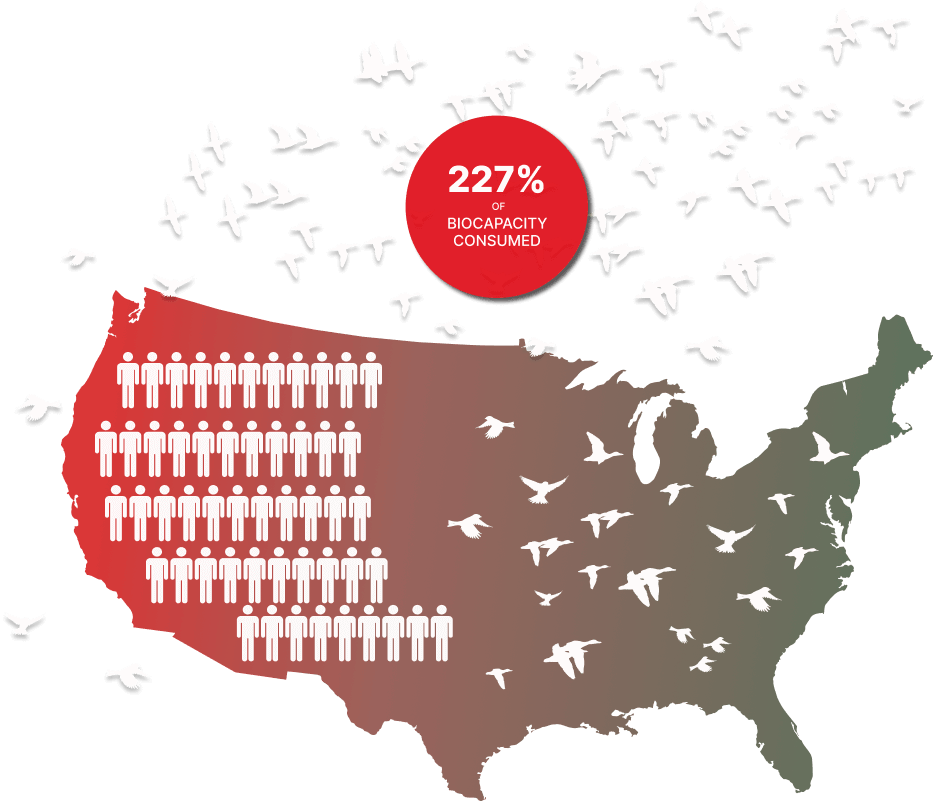
205 Million
10 Billion
227%
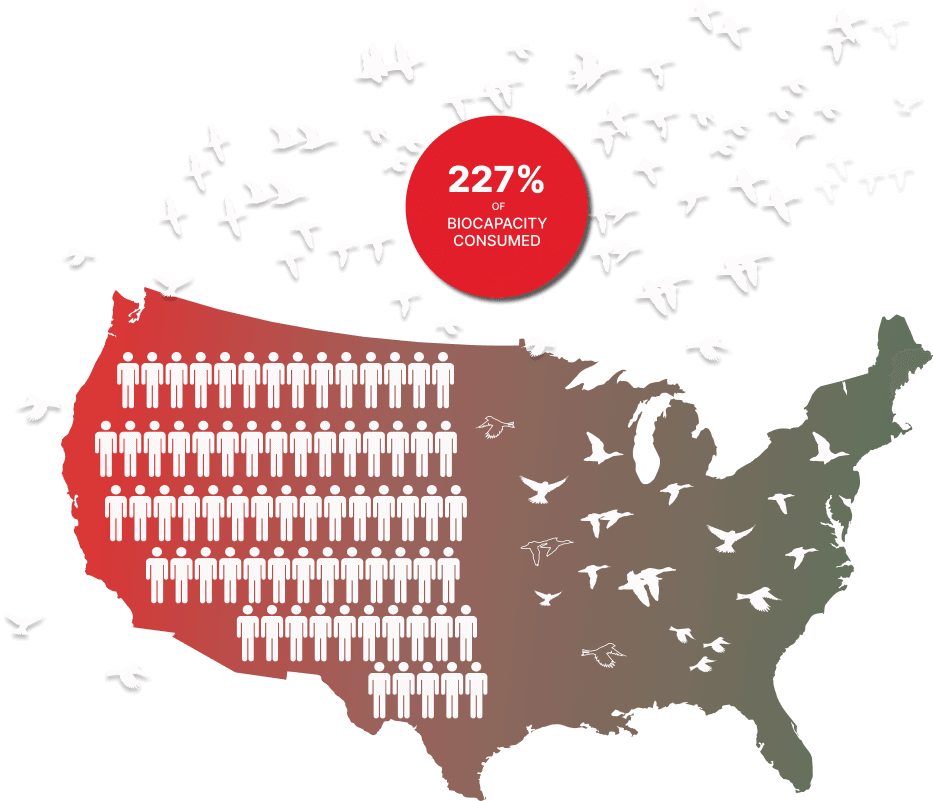
210 Million
9.8 Billion
227%

250 Million
8.3 Billion
237%
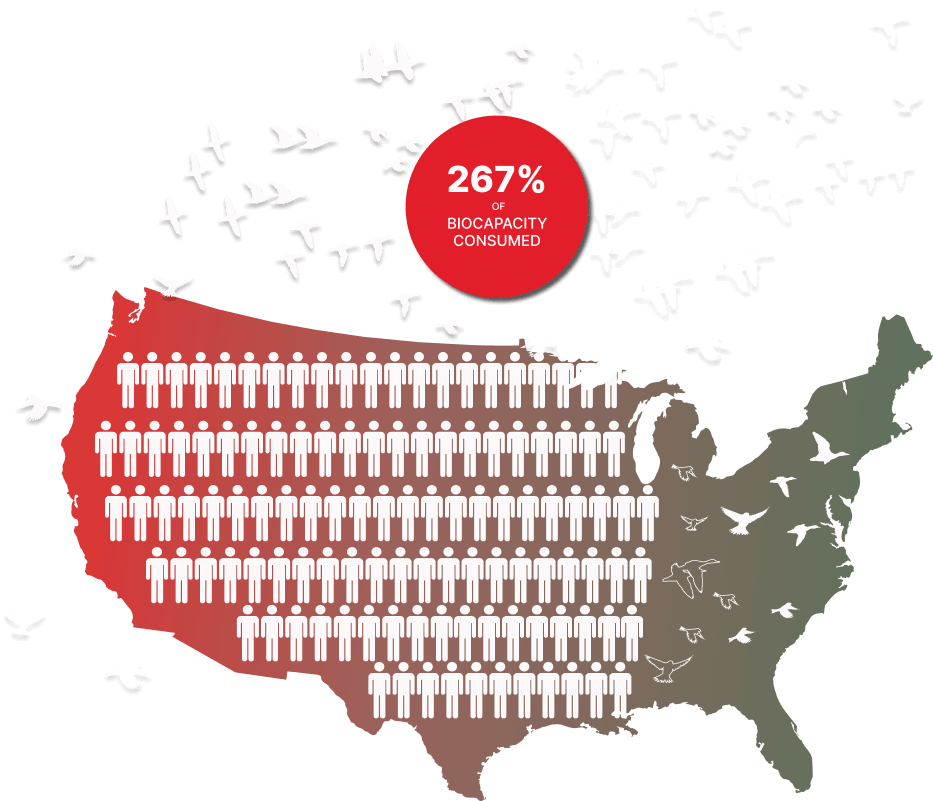
282 Million
7.6 Billion
267%
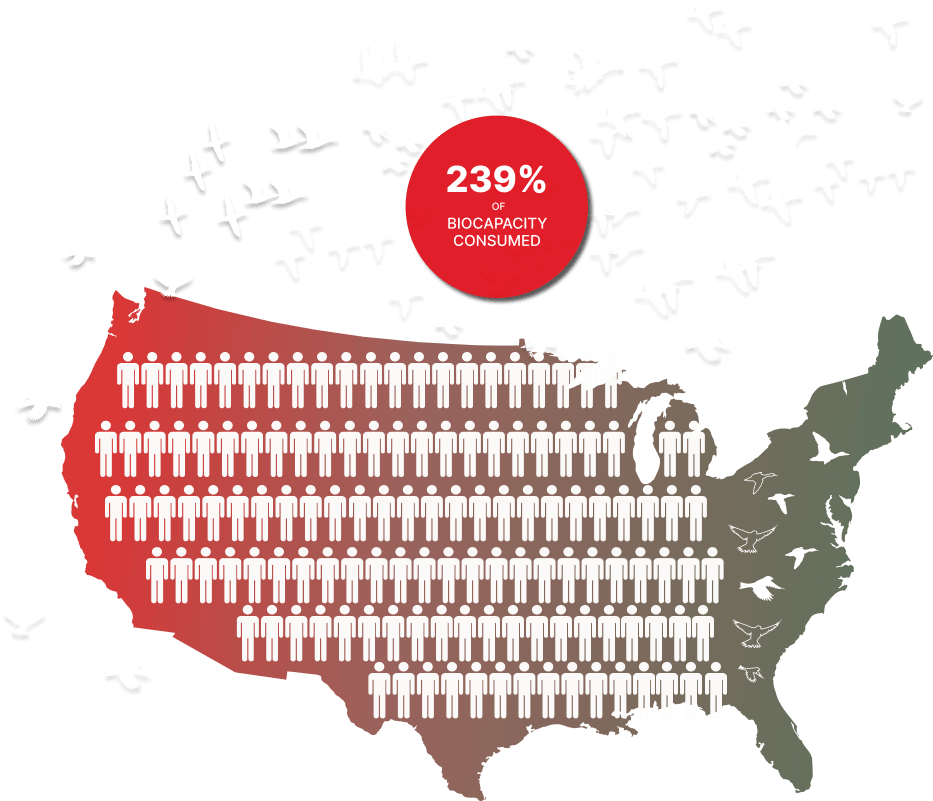
330 Million
7.1 Billion
239%
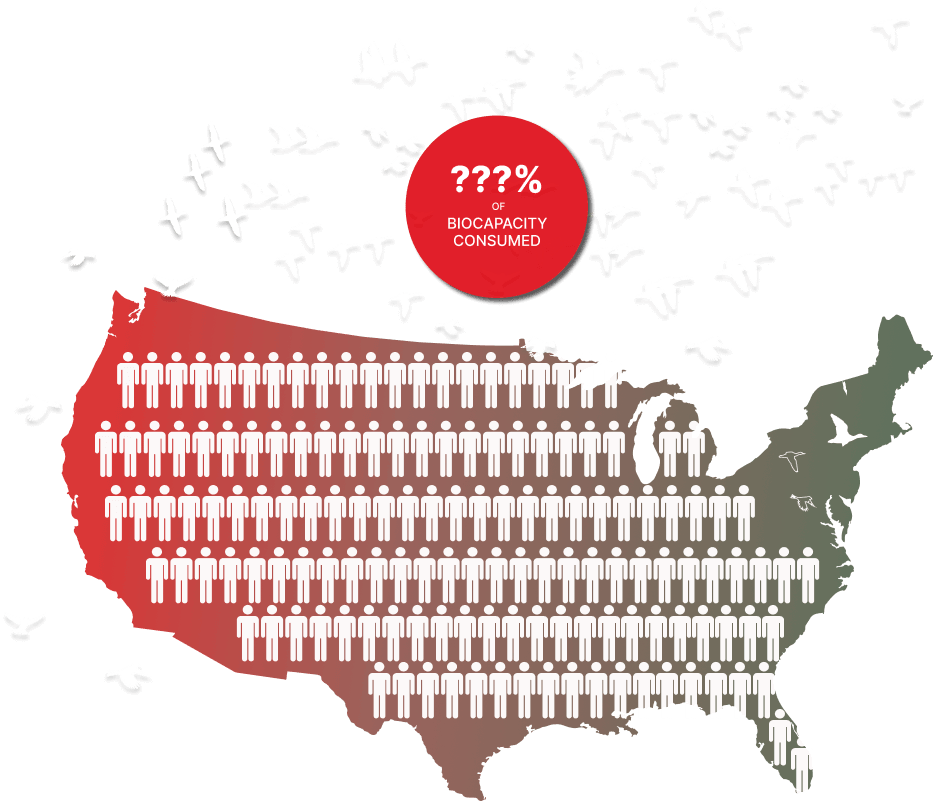
350 - 440+ Million
?
???%